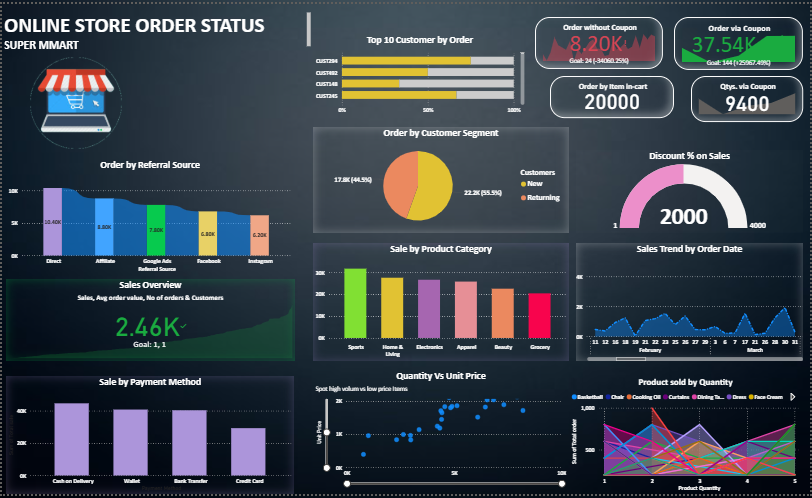
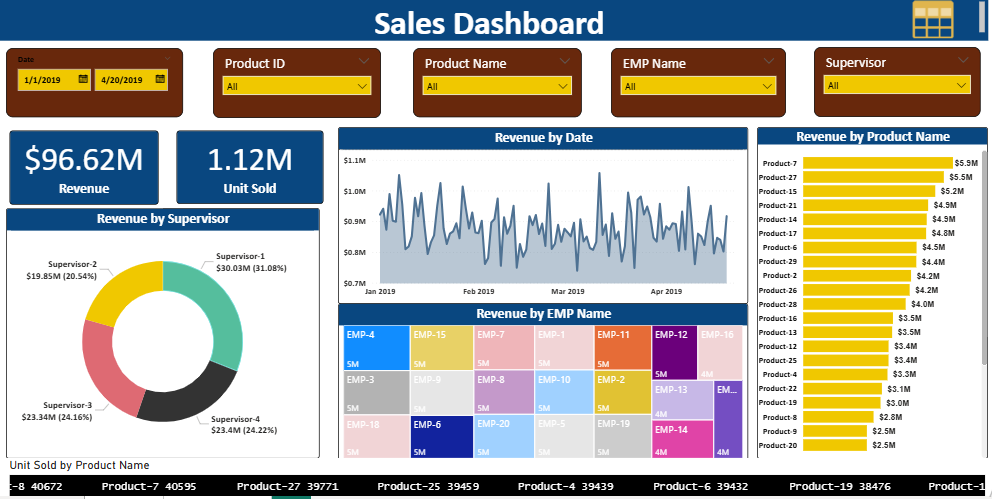
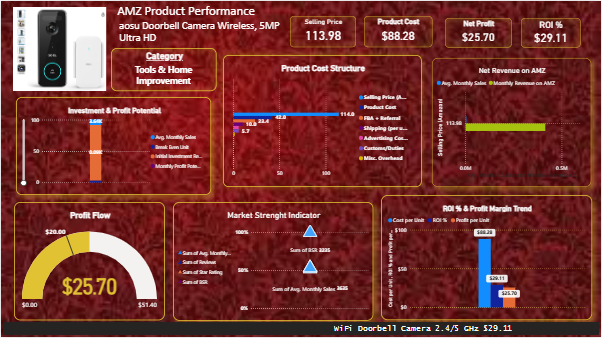
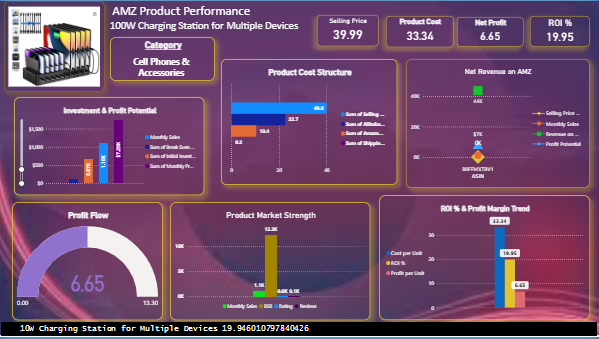
Sales Performance Dashboard
A comprehensive dashboard designed to track sales revenue, profit margins, and product performance. It highlights top-selling products, underperforming categories, and seasonal sales patterns; enabling the client to optimize their sales strategy and pricing decisions.
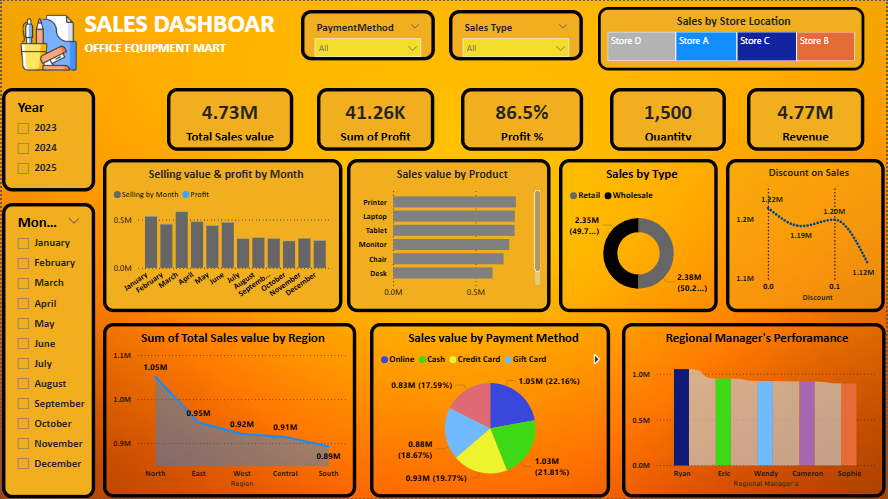
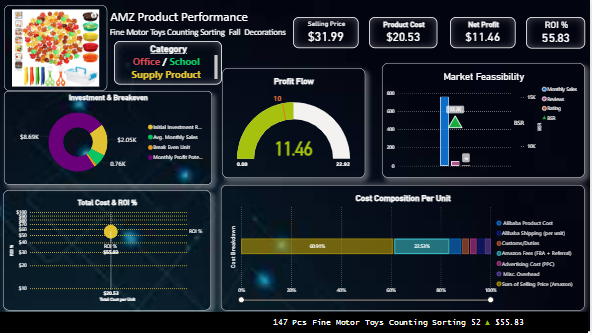
Customer Insights Dashboard
Focused on understanding customer behavior and preferences, this dashboard provided insights into purchase patterns, retention rates, and loyalty trends. It helped the client enhance customer engagement through personalized marketing and improved service strategies.
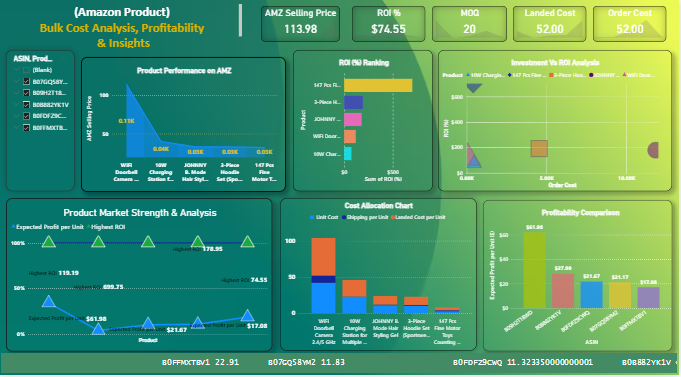
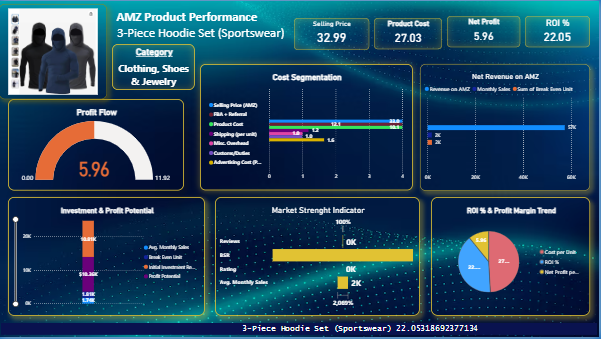
Inventory Tracking Dashboard
Designed to measure and monitor key operational KPIs, this dashboard identified process bottlenecks and resource inefficiencies. By visualizing performance metrics and turnaround times, it enabled the client to streamline workflows and boost operational productivity.
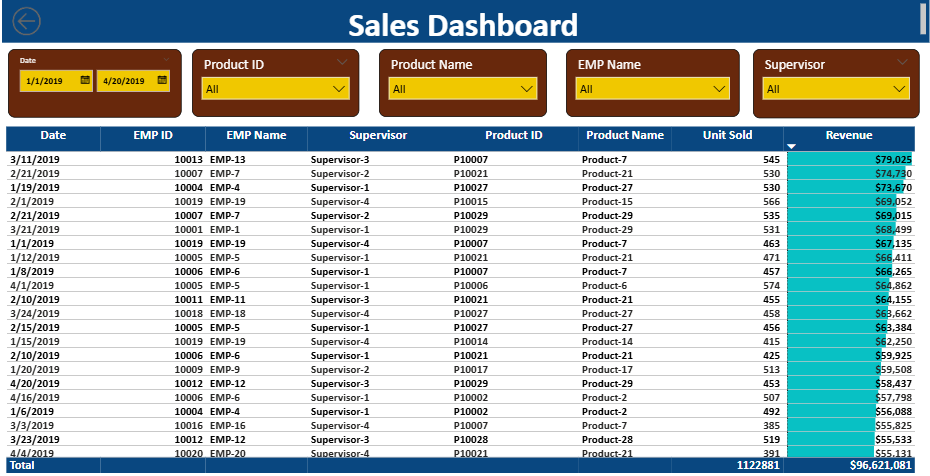
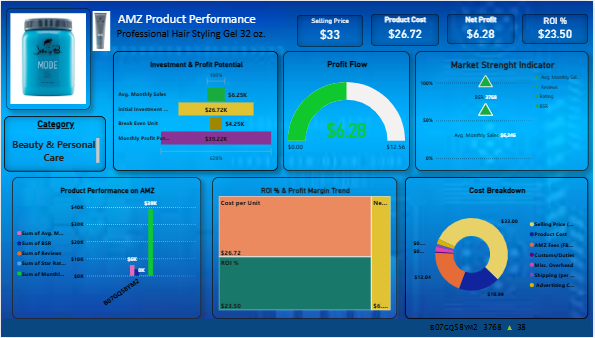
Financial Analysis Dashboard
This dashboard provided a clear picture of the client’s financial health, tracking cash flow, expense breakdowns, and profitability over time. It helped decision-makers identify cost-saving opportunities and plan for sustainable financial growth.